Case: A 56-year-old man with a medical history of schizophrenia, tobacco abuse, and coronary artery disease presented to our emergency department for chest pain. The patient had drug-eluting stents placed to the mid-circumflex and right coronary arteries 13 months before the current presentation. He reports that he has not been taking aspirin or clopidogrel due to financial limitations. He also continues tobacco use of ½ pack a day. The patient describes 3 weeks of severe left-sided, exertional chest pain and associated dyspnea. The pain is normally relieved with rest and ibuprofen, but over the past two days he has had similar pain at rest with only intermittent relief. The following electrocardiogram was obtained:  ECG Interpretation:
Diagnosis:
Wellens syndrome Significance of Findings:
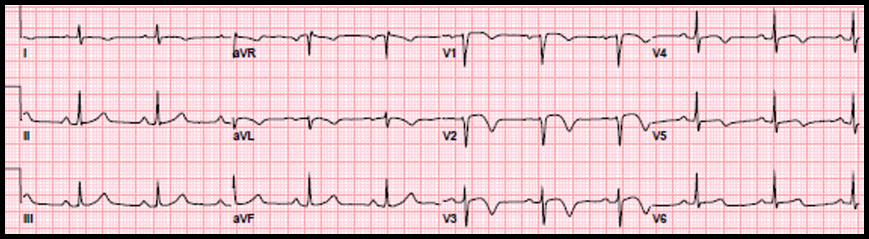
Image Source: https://www.ncbi.nlm.nih.gov/books/NBK482490/ Diagnostic criteria of Wellens syndrome:
Management:
Patient Disposition:
The patient was admitted to the interventional cardiology service. Cardiac catheterization revealed 99% stenosis of the left main coronary artery, 50% stenosis of the left anterior descending coronary artery and 100% occlusion of the previously stented left circumflex. The previously stented right coronary artery was patent.
Results of cardiac catheterization are shown below: 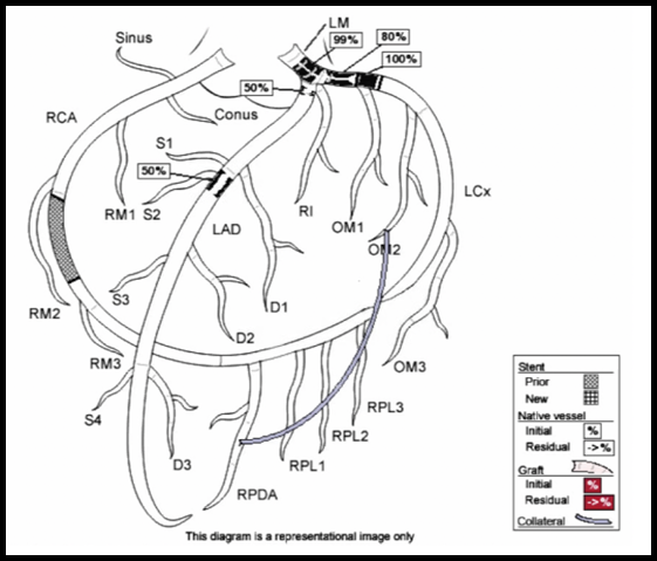
Interventions: Due to the extent of stenoses, the patient had an intra-aortic balloon pump placed to reduce myocardial oxygen demand. The next day, he underwent multivessel coronary artery bypass grafting. Socio-economic considerations: This case highlights the importance of dual antiplatelet therapy and smoking cessation in patients with stent placement. It also demonstrates the challenges mental health and socioeconomic factors play in the patients’ ability to adhere to treatment plans. Dr. Littmann’s comments:
There are 4 major types of high-risk acute coronary syndrome (ACS) where the ECG does not show diagnostic ST-segment elevation. These include:
References:
0 Comments
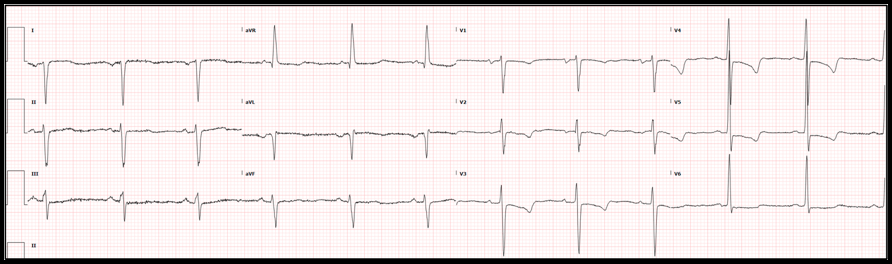
Case: A 36-yo obese female with no other known past medical condition presented to the emergency department with a 30-minute history of chest pain. The pain was described as being a retrosternal pressure-like discomfort that was non-radiating, and 10/10 in severity. The patient denied having similar episodes in the past. There were no alleviating or worsening factors. During the physical examination, the patient was noted to have the Levine’s sign (clenched fist held over her chest). The following electrocardiogram was obtained: 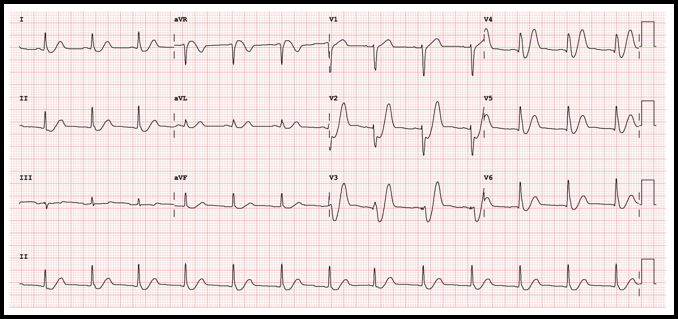 ECG Interpretation
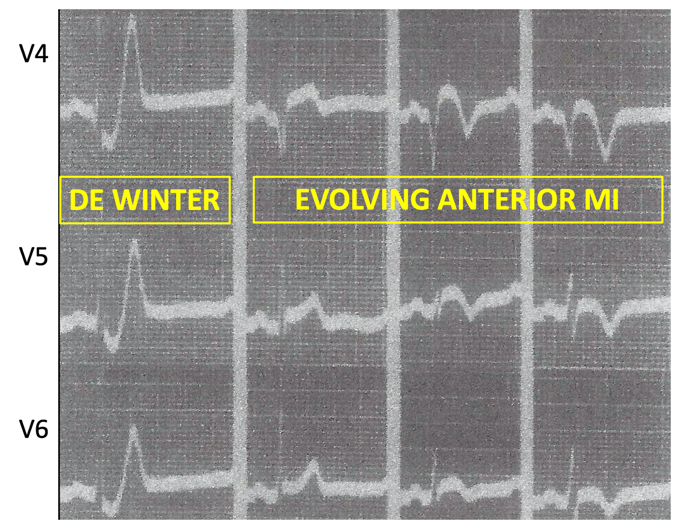
Rate: 78/min Rhythm: Normal sinus rhythm Axis: Normal QRS axis QRS: <120 msec; no abnormal Q waves ST-T: ST depression at the J point (at the junction between the QRS complexes and ST segments) in the anterior/lateral leads, mostly upsloping ST segments and then, very tall peaked T waves (de Winter T waves). ST segment elevation in aVR. Significance of ECG Finding
Disposition
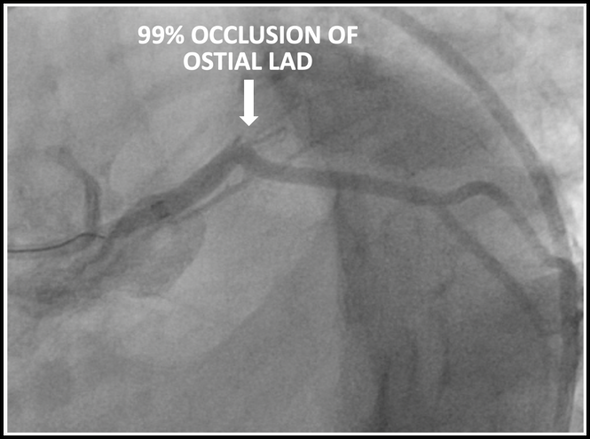
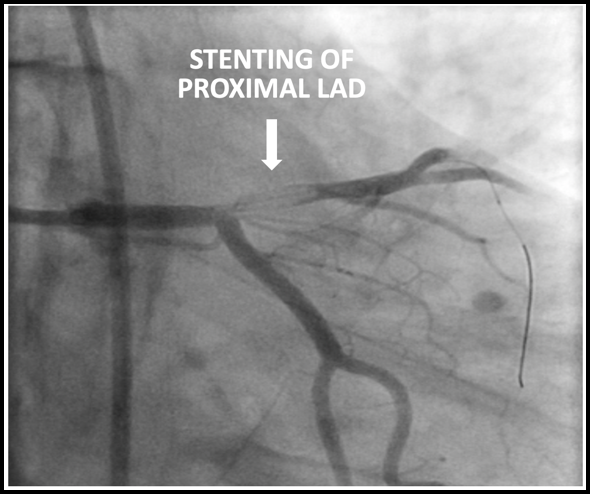
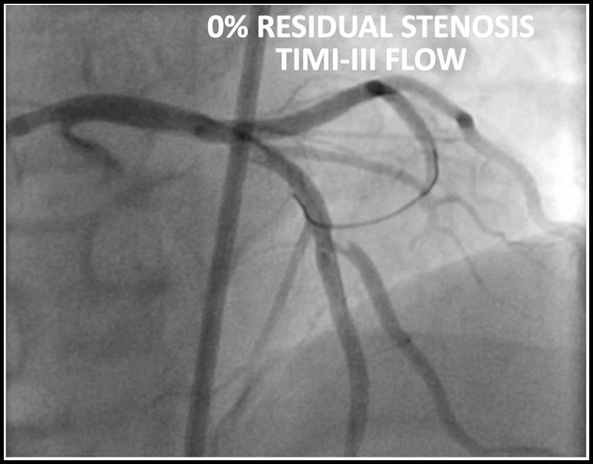
The patient underwent emergent cardiac catheterization which found a 99% occlusion of the ostial LAD. The initial troponin-T was 4.78ng/mL and peaked at >50ng/mL (detection limit) later that day. It is important to remember that a positive troponin is not needed to make the diagnosis of STEMI or a STEMI equivalent.
Results of cardiac catheterization and stenting of the proximal LAD are shown below
Dr. Littmann’s comments:
Drs. Sabatini-Regueria and Fleming have beautifully summarized our current understanding of the de Winter sign, its prevalence, clinical significance, possible mechanism and the somewhat controversial guideline recommendations how to proceed when it is manifest. I have a few comments about the de Winter sign:
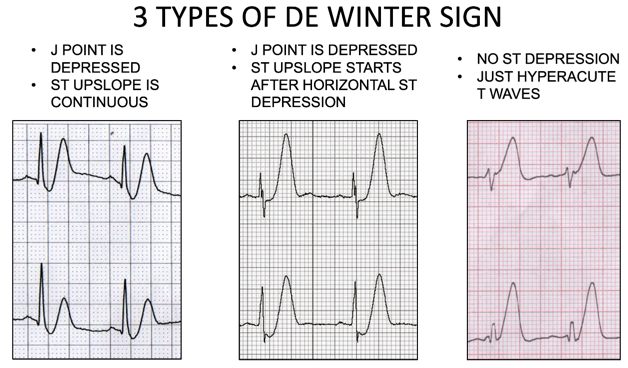
Below are the three types of de Winter ECGs. Note that in the third type, there is no ST depression, just hyperacute T waves.
Below is an edited version of the de Winter sign as described by Dr. Dressler in 1947
References (all represented by DOI numbers):
10.1056/NEJMc0804737 10.1016/0002-8703(47)90343-8 10.1016/j.jacc.2018.08.1038 10.1016/j.ajem.2013.09.037 10.12998/wjcc.v7.i20.3296 10.4103/HEARTVIEWS.HEARTVIEWS_90_19 10.1155/2018/6868204 10.21037/atm.2019.07.19 10.1016/j.jelectrocard.2017.08.024 10.1016/j.jacc.2020.07.015  By: Andrew Yde, MD Editors: Drs. Littmann and Gibbs Case: A 61-year old woman with coronary artery disease and interstitial lung disease, on home O2 therapy, presented with a 3-day history of constant right-sided chest pain radiating to the right neck. She also complained of worsening dyspnea and exertional lightheadedness. On physical examination, the patient was afebrile, had a heart rate in the 60s, was mildly hypertensive at 147/71 mmHg, and was maintaining normal oxygen saturations on 2L supplemental O2. The examiner did not note abnormalities on cardiopulmonary exam. Chest CT angiogram was negative for pulmonary embolism and high sensitivity troponin was <6. She was given morphine and Toradol with some relief in her chest pain. The following electrocardiogram was obtained: 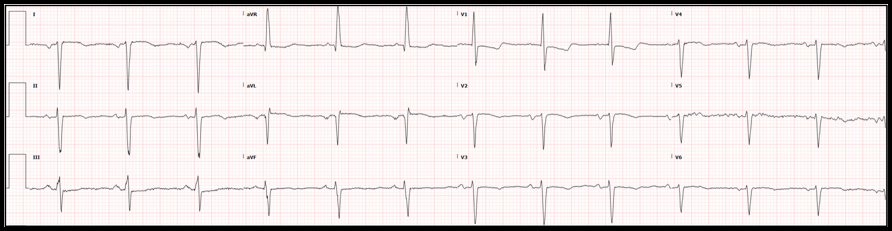 Physician interpretation of the ECG was as follows: Normal sinus rhythm with a rate of 67, right axis deviation, otherwise normal intervals. ST depression in the septal and lateral leads. No ST elevation. When compared to an ECG obtained two months before, the complex morphology is generally unchanged. The ST depression is a bit more pronounced. What is your interpretation of this initial ECG? Do you agree with the physician interpretation?
Do not agree. The ECG shows sinus rhythm with dextrocardia. The ST-T morphology cannot be reliably assessed. Repeat ECG with limb leads reversed, and place right-sided chest leads. Summary of key ECG findings:
In this patient with dextrocardia, the chest leads were reversed but the limb leads were not. See ECG below:
Note that the limb leads remained unchanged, but the QRS progression in the chest leads has normalized. One can now diagnose probable left ventricular hypertrophy (LVH) with secondary repolarization abnormality vs. anterolateral ischemia. As the repolarization abnormality was identical to that seen two years before, LVH was the more likely diagnosis. Possible abnormalities in the limb leads may have remained obscure. Proof of situs inversus totalis:
(1) ECG showing dextrocardia – see above.
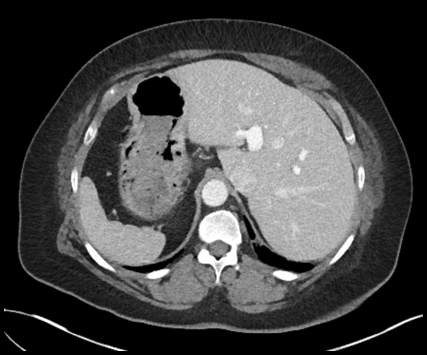
(2) Chest X-ray demonstrating a right-sided heart with the ventricular apex pointing to the right – below left. (3) Abdominal CT showing the liver on the left and the spleen on the right – below right. The abdominal CT was recorded during a prior admission.
Hospital Course:
Two sets of high-sensitivity troponin measurements remained within normal limits. An echocardiogram showed new moderate biventricular dysfunction with left ventricular ejection fraction (LVEF) calculated at 35%, changed from echocardiogram three years prior in which biventricular function was normal and LVEF was 55%. Given a history that was concerning for ischemia and new biventricular dysfunction, the Cardiology service recommended cardiac catheterization which revealed calcification and minor luminal irregularities of all coronary vessels and a 50% stenosis of the mid left main coronary artery. No stents were placed, and medical management was recommended. The patient experienced several bouts of right sided chest pain reliably relieved by oral Tylenol. Her chest pain was felt to be musculoskeletal in nature. She was discharged in stable condition with follow-up appointments with both her primary care physician and Cardiology. What is situs inversus, and what does it mean for our patient? Situs solitus refers to the normal orientation/location of the thoracic and abdominal viscera. In situs solitus, we find a tri-lobed right lung, a bi-lobed left lung, and a heart on the left side with the apex facing left. The liver and gallbladder are on the right, the spleen is present on the left, the descending colon is on the right, the ascending colon on the left, and the inferior vena cava (IVC) runs to the right of the aorta in the abdomen, etc. In 1 out of 10,000 people, the orientation of the thoracic and abdominal viscera is reversed - a heterotaxy syndrome called situs inversus. Of these patients, the vast majority have situs inversus totalis, in which the heart is in the right chest with the apex oriented toward the right (dextrocardia). The remainder of the thoracic and abdominal viscera are in positions exactly mirroring situs solitus. For example, the right lung is bi-lobed, the left lung is tri-lobed, the liver and gallbladder are on the left side, the spleen is on the right side, the ascending colon is on the left, the descending colon is on the right, the IVC runs to the left of aorta in the abdomen, etc. Approximately 2-5% of these patients will have congenital cardiac anomalies, but the vast majority will be asymptomatic with normal quality of life and life expectancy. Approximately 1 in 22,000 people in the general population will have situs inversus with levocardia, meaning that, although the thoracic and abdominal viscera are in mirror/reverse position from situs solitus as in situs inversus totalis, the heart remains in levocardia (its normal orientation), located in the left chest with the apex oriented toward the left. Nearly 100% of these patients have congenital cardiac anomalies, usually of the cyanotic variety (i.e. transposition of the great vessels). These patients have a severely shortened life expectancy. In fact, only about 5-13% of patients with situs inversus with levocardia survive beyond 5 years of age. Of patients with situs inversus totalis, 17-25% will have Kartagener syndrome characterized by chronic sinusitis, bronchiectasis and situs inversus. This syndrome is a result of dynein protein abnormalities causing impaired mucociliary clearance, known as primary ciliary dyskinesia. Interestingly, only 50% of patients with primary ciliary dyskinesia will have situs inversus, and thus only 50% will meet official criteria for Kartagener syndrome. Based on radiographic, echocardiographic, and ECG evidence proving dextrocardia, CT angiography of the chest confirming a tri-lobed left lung and bi-lobed right lung, and CT abdomen obtained during previous hospital admission, our patient has situs inversus totalis without associated primary ciliary dyskinesia. She had no evidence of congenital cardiac abnormalities on her echocardiogram or catheterization. She had respiratory bronchiolitis associated interstitial lung disease and chronic obstructive pulmonary disease, both secondary to a greater than 25 pack-year history of cigarette smoking, rather than chronic sinusitis. This patient’s coronary disease did not seem to be related to her underlying situs inversus totalis, but rather due to the significant smoking history, diabetes, and hypertension. Dr. Littmann’s comments:
If you order an ECG, please spend a couple of minutes to analyze it. The first steps include rate, regularity and rhythm. Then go left-to-right, starting with the P waves. The normal sinus P wave cannot be negative in lead I as the SA node is in the upper right atrium and therefore, atrial activation is right-to-left, going towards lead I. If the P wave is negative in lead I, follow the steps below:
Below is an example of right arm – left arm lead reversal. Note that the limb leads look essentially identical to what was seen in dextrocardia (everything negative in lead I, upright P, QRS and T in aVR and negative P, QRS and T in aVL), but in the chest leads, there is normal R-wave progression.
References:
Case: A 69-year old man with ischemic cardiomyopathy (LVEF 30%), and a history of both ventricular tachycardia and recurrent atrial flutter, s/p ICD placement, presented with one day of palpitations and associated lightheadedness. His cardiac medications included amiodarone and apixaban (Eliquis). His heart rate was 131 beats/min and regular, blood pressure was 103/84 mmHg. On exam he was slightly diaphoretic and anxious, but in no acute distress. The ECG interpretation software indicated sinus tachycardia with nonspecific intraventricular conduction delay and acute inferior infarct (LCX). This was over-read by the providers as atypical atrial flutter. He received IV amiodarone bolus and drip. The following electrocardiogram was obtained: 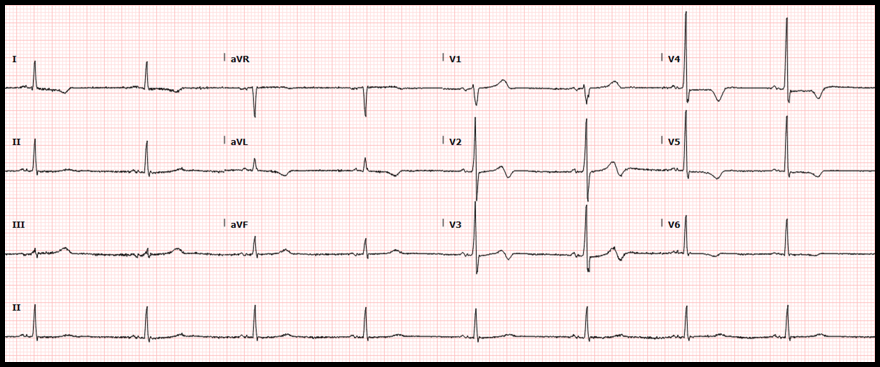 Presentation ECG Here is the patient’s baseline ECG for comparison: 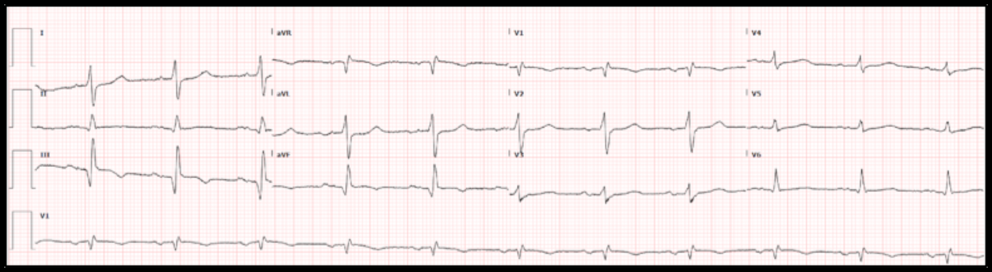 What is your interpretation of the ECGs? Do you agree that this was atrial flutter?
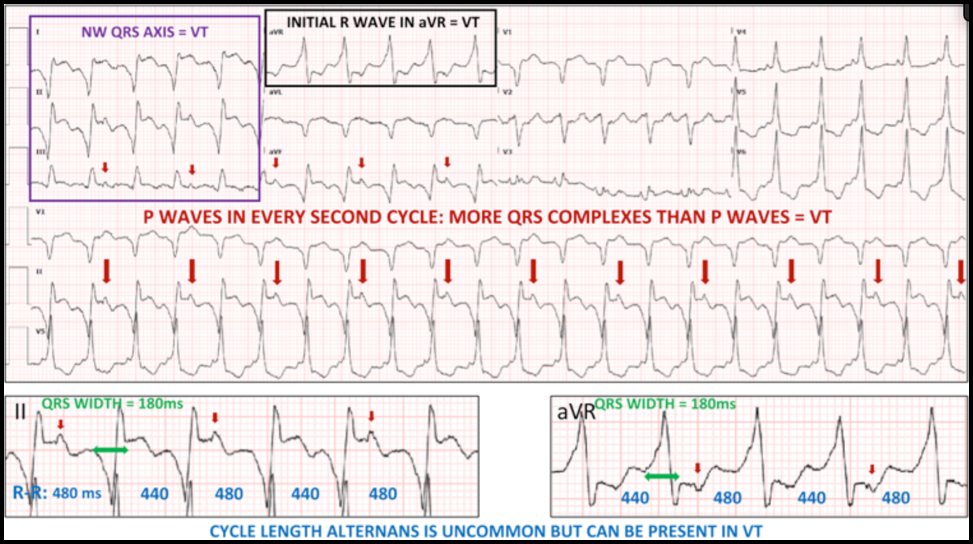
Correct interpretation of the ECG:
Summary of Key Clinical and ECG Findings (see annotated ECG below):
Hospital Course:
The patient remained in WCT overnight. Next morning, he underwent successful electrical cardioversion and was discharged home with a diagnosis of atrial flutter. Over a follow-up of 3 months, he did not have recurrence of the tachycardia. Dr. Littmann’s Comments:
Ventricular tachycardia (VT) is often misdiagnosed as SVT. This phenomenon was first described almost 50 years ago. Despite numerous publications and reviews raising awareness to this problem, the misdiagnosis of WCT, unfortunately, continues to be very common. As described above, there are numerous ECG clues that can help you diagnose VT. The most important factor, however, is the clinical likelihood: of all WCTs, about 80% are VT. In patients with heart disease, 90-95% of WCT is VT. “Probable VT” should always be your default diagnosis. It is OK not to remember any of the ECG clues listed by Drs. Kastner and Plate. If you are not sure, just give IV adenosine. In this case, it is reasonable to raise a few additional legitimate questions: • Why was the VT relatively slow? The patient was on amiodarone which, by suppressing conduction velocity of the reentry circuit, can markedly slow down the rate of VT. • Why did the ICD not shock the patient? Probably because of the relatively slow heart rate. ICDs are usually programmed to deliver shocks at faster rates. • Would it have been important to diagnose, or at least consider, the diagnosis of VT? Yes, because an attempt could have been made to overdrive pace the ventricles with the help of the pacemaker/ICD. Slow VTs are uniquely susceptible to overdrive pacing. If successful, it could have immediately resolved the tachycardia and cardioversion, even hospital admission, may have been avoided. In addition, the ICD could have then been reprogrammed to provide automatic overdrive pacing if a similar tachy-event were to be detected in the future. References:
1. Littmann L, Olson EG, Gibbs MA. Initial evaluation and management of wide-complex tachycardia: a simplified and practical approach. Am J Emerg Med 2019;37:1340-5. 2. Vereckei A, Duray G, Szénási G, Altemose GT, Miller JM. A new algorithm using only lead aVR for the differential diagnosis of wide QRS complex tachycardia. Heart Rhythm 2008;5:89-98.
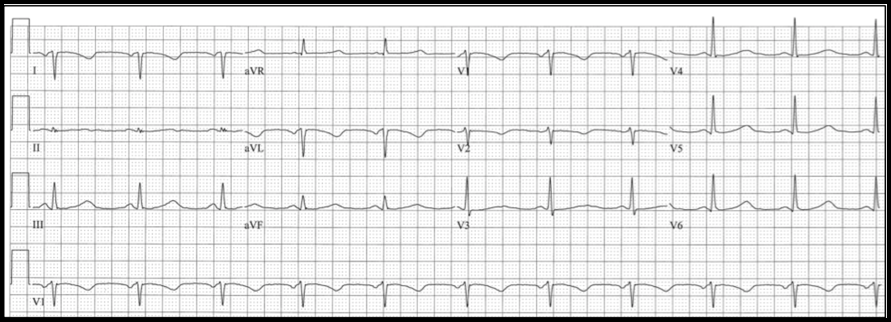
Case: A 63-year-old male with a history of traumatic brain injury and associated seizure disorder presented from a skilled nursing facility after experiencing syncope and recurrent seizures. EMS reported occasional heart rates in the 200s. The patient received 5 mg of midazolam IM and the seizure activity resolved. On evaluation, he appeared to be post-ictal and minimally responsive. He had a normal pupillary exam and was withdrawing all four extremities. He was tachycardic at 136/min, blood pressure 105/75 mmHg, respiratory rate 20/min and oxygen saturation 95% on room air. The following electrocardiogram was obtained: 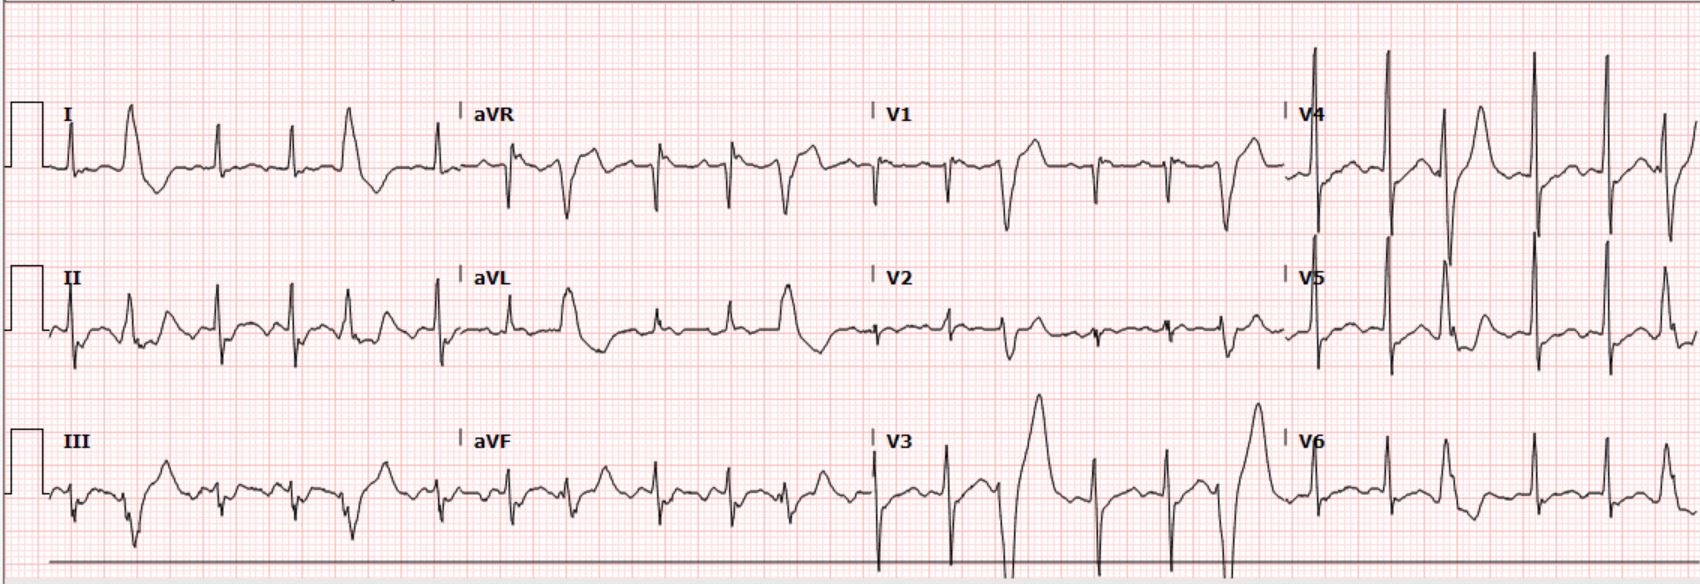 Interpretation by ECG software, confirmed by a physician Sinus tachycardia with frequent premature ventricular complexes What is your interpretation of the ECGs?
Correct interpretation of the ECG Atrial flutter with 2:1 AV conduction and frequent premature ventricular complexes Summary of key ECG findings:
CLUES:
Clues to recognizing 2:1 flutter include the following simple “tricks”
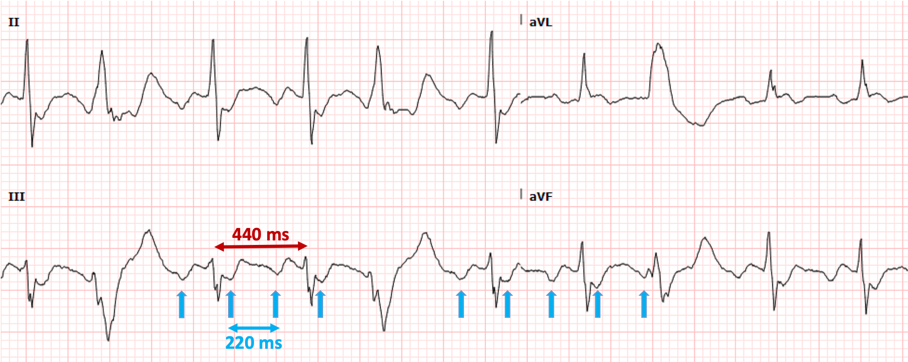
In this enlargement of the inferior leads, see the negative P waves spaced at exactly half of the R-R intervals.
Significance of finding?
Significance of recognizing 2:1 flutter in cases initially interpreted as sinus tachycardia
HOspital Course
Hospital Course The patient’s pre-hospital report of extreme tachycardia raised the possibility of 1:1 flutter and possibly syncope due to the dysrhythmia rather than seizure. Cardiology evaluated the patient and recognized the atrial flutter. The patient was given IV diltiazem which resulted in excellent rate control. It was felt that because of his brain injury and seizures, the patient was not a candidate for chronic anticoagulation. Catheter ablation was discussed but eventually rejected. Echocardiogram revealed right ventricular dilatation and hypokinesis, moderate tricuspid regurgitation, moderate pulmonary hypertension and marked right atrial dilatation. Dr. Littmann’s Comments
Atrial flutter with 2:1 AV conduction (“2:1 flutter”) is one of the most commonly missed ECG diagnosis, both by the interpretation software and by providers. 2:1 flutter should always be entertained if the computer diagnoses “sinus tachycardia” but there is either an abnormal P-wave morphology and/or an abnormal PR interval. Consistent misreadings by the interpretation software include sinus tachycardia with first-degree AV block, sinus tachycardia with very short PR intervals, and ectopic atrial tachycardia. The most important factor in recognizing 2:1 flutter is to always consider this diagnosis in sick patients who present with a regular SVT. Once the diagnosis of 2:1 flutter is entertained, it is usually easy to prove it by using the “halving method”: recognizing negative P waves in the inferior leads whose distance is exactly half of the R-R intervals. If uncertain, the use of IV adenosine, by exposing the flutter waves, can be very helpful. From the ED physician’s perspective, the most important job is to recognize the flutter and provide rate control. In patients who present repeatedly with atrial flutter, it is also prudent to suggest to the accepting team that curative treatment with catheter ablation should be entertained and discussed with cardiology. 1/14/2020 0 Comments December 2019 ECG LessonThis month’s EKG is brought to you by Dr. Clayton Long. Editors: Drs. Littmann and Gibbs  Clayton Long, MD Clayton Long, MD Case A 67-year-old male with 6-12 month history of recurrent syncope presented to the ED with facial trauma following a syncopal event. The patient experienced multiple prodromal episodes of presyncope in short succession, ultimately culminating in true syncope causing a nasal fracture. He refused additional work-up at the time of injury given his history of extensive previously negative evaluations for syncope. He had received multiple ECGs, nuclear stress testing and echocardiography in the past. The results of his past evaluations were unrevealing, and he was referred to a specialist with no further clarity provided. Within weeks he returned for outpatient surgical repair of his nasal fractures. In the perioperative period he was noted to have AV block on telemetry which self-resolved. He was reportedly symptomatic at the time this rhythm was recognized and was referred for subspecialty Cardiology – Electrophysiology (EP) for evaluation where the following ECGs were obtained. 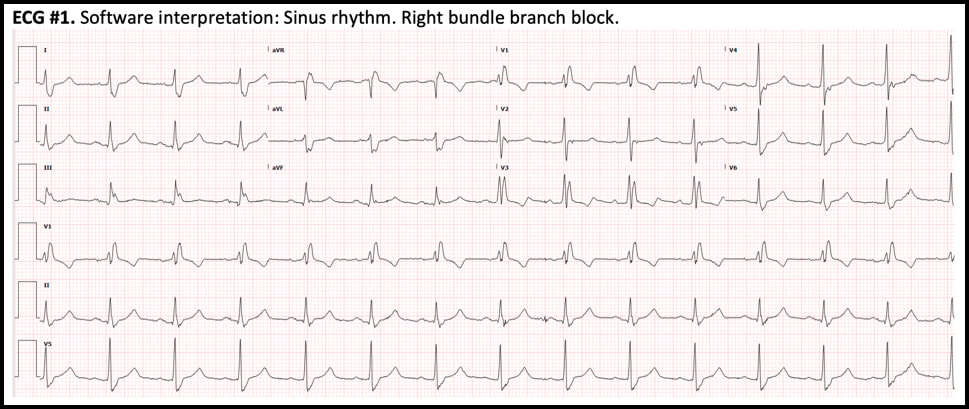 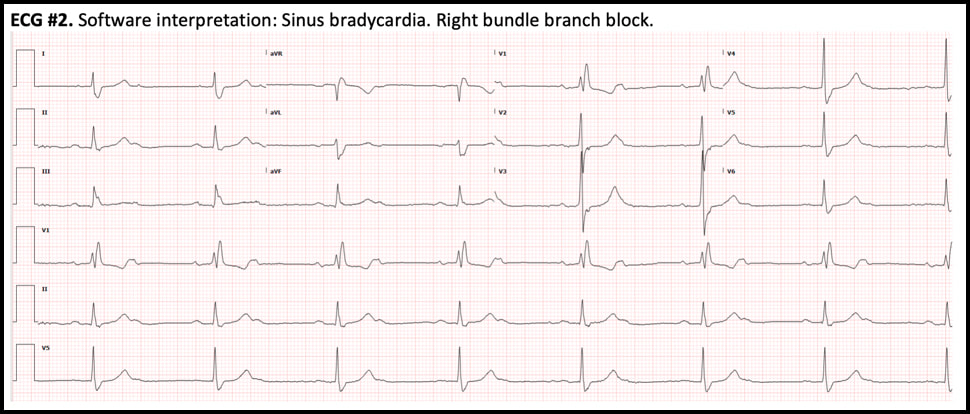 What is your interpretation of the ECGs?
Correct interpretation of the ECGs
ECG #1 - NSR with normal PR, normal QRS axis and RBBB - Sinus rate of 85/min with 1:1 AV conduction ECG #2 - Regular bradycardia, still normal PR intervals and normal QRS axis, unchanged RBBB pattern - The sinus rate is now 90/min with 2:1 AV block; hence, the ventricular rate is 45/min - Blue arrows below demonstrate twice as many sinus P waves as QRS complexes 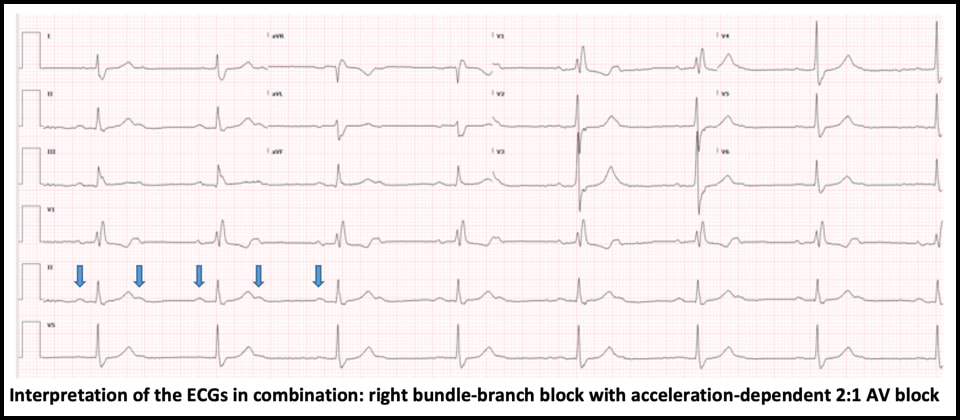
Significance of these findings?
These ECG findings are consistent with right bundle-branch block and acceleration-dependent second-degree AV block where there is 1:1 AV conduction at slower sinus rates but 2:1 AV block at faster atrial rates. Acceleration- dependent AV block localizes the block to the His-Purkinje system, which is characterized by all-or-none conduction. At a critical sinus rate, only every other sinus impulse is able to conduct through the His-Purkinje system and every other P wave is blocked. On the conducted complexes, there is no change in the PR interval. The blocked P waves are almost never recognized by the interpretation software, which usually reads the rhythm as sinus bradycardia, a clinically trivial dysrhythmia. Therefore, the ECG must be carefully scrutinized in order to identify this ominous rhythm and the correct diagnosis. - In this case, slowing down the sinus rate with carotid massage or IV beta-blocker can paradoxically improve AV conduction. - Atropine, on the other hand, is contraindicated because it can worsen AV conduction by increasing the sinus rate. - This finding is concerning for extensive distal conduction disease. Patients with bundle-branch block and acceleration-dependent AV block are at high risk of complete heart block at an anatomically distal level, which may result in asystole and cardiac arrest. - This finding requires urgent EP evaluation and is an absolute indication for dual-chamber (AV sequential) pacemaker implantation Hospital Course
The patient was admitted directly from the outpatient EP office visit to Cardiology for permanent pacemaker implantation. He received a dual-chamber pacemaker. He continued to experience syncopal symptoms following his initial procedure due to intermittent loss of lead capture requiring revision and a brief admission to the cardiac ICU. The remainder of his hospitalization was uncomplicated, and he was discharged shortly thereafter with no recurrence of symptoms. During his first outpatient EP follow-up he was noted to be asymptomatic with no recurrence of syncope and a fairly low pacing burden. EP noted that they anticipate his pacing burden will increase over time. Summary
This patient had right bundle-branch block and an occult acceleration-dependent 2:1 AV block that was present but unrecognized on the ECGs during multiple prior ED visits for syncope. Bundle-branch block combined with acceleration dependent 2:1 AV block is indicative of extensive distal conduction system disease and requires urgent EP evaluation for pacemaker implantation to avoid degeneration to complete heart block and potentially, cardiac arrest. This rhythm is rarely detected by the interpretation software and will be missed on ECG review unless thoughtfully searched for. Dr. Littmann’s Comments
It is well known that patients with bifascicular block are at risk of developing complete heart block. This is especially true for patients with bifascicular block who experience syncope. It is less appreciated, but still well documented that patients with simple left or right bundle branch block and syncope too, as in the current case, are frequently found to have paroxysmal AV block and asystole.1 Based on these data it is recommended that patients with unexplained syncope who have any type of intraventricular block should undergo prolonged monitoring with an implanted loop recorder (class I recommendation).2 In this case, the patient had numerous previous workups by cardiologists and underwent a number of minimal value testing such as echocardiography and stress testing, but was never offered cardiac monitoring. A second important lesson of the case is that 2:1 heart block is almost never recognized by interpretation softwares and is rarely recognized by providers. Most cases are interpreted as sinus bradycardia, which is usually a more benign dysrhythmia. Whenever a patient’s ECG appears to demonstrate regular sinus bradycardia, please carefully search for twice as many P waves than meets the eye by halving the interval between the conducted P waves. This “trick” only takes a few seconds to do. It is most important to search for 2:1 heart block in patients who have bundle-branch block and in patients who present with presyncope or syncope. Key references
|
AuthorThis blog represents important ECG lessons that the Emergency Medicine Residents from Carolinas Medical Center (Charlotte, NC) rotating through the Cardiology service encounter. Test your knowledge with them! The esteemed educators Dr. Laszlo Littmann and Dr. Michael Gibbs serve as the primary content editors and course directors. Archives
September 2020
CategoriesAll Bradycardia Cardiology ECG Lesson Heart Block Syncope Ventricular Tachycardia Vtach |


 RSS Feed
EMGuideWire |
|
LEGAL DISCLAIMER (to make sure that we are all clear about this):The information on this website and podcasts are the opinions of the authors solely.
For Health Care Practitioners: This website and its associated products are provided only for medical education purposes. Although the editors have made every effort to provide the most up-to-date evidence-based medical information, this writing should not necessarily be considered the standard of care and may not reflect individual practices in other geographic locations.
For the Public: This website and its associated products are not intended to be a substitute for professional medical advice, diagnosis, or treatment. Your physician or other qualified health care provider should be contacted with any questions you may have regarding a medical condition. Do not disregard professional medical advice or delay seeking it based on information from this writing. Relying on information provided in this website and podcast is done at your own risk. In the event of a medical emergency, contact your physician or call 9-1-1 immediately.